Content Analytics Report
Content Analytics Report
Product: Muvi One (Classic)How to View Video Analytics Report
How to View Audio Analytics Report
Filtering Options in Content Analytics Report
Different Columns in Content Analytics Report
Downloading Content Analytics Report
Introduction
Content Analytics report shows the customized analytic graph of the number of videos watched, audios listened, bandwidth consumed by your user, the number of hours videos watched, devices on which videos are watched or audios have listened and more... We encode your videos into multiple resolutions to save the bandwidth cost. The detailed report can be downloaded in CSV format.
Note: Usually, our system updates the data in the analytics between 1-24 hours of any content viewed in your store. That means, if an end-user viewed any content, the data is not reflected in the analytics immediately. It takes around 1-24 hours to reflect the data in the analytics.
How to View Video Analytics Report
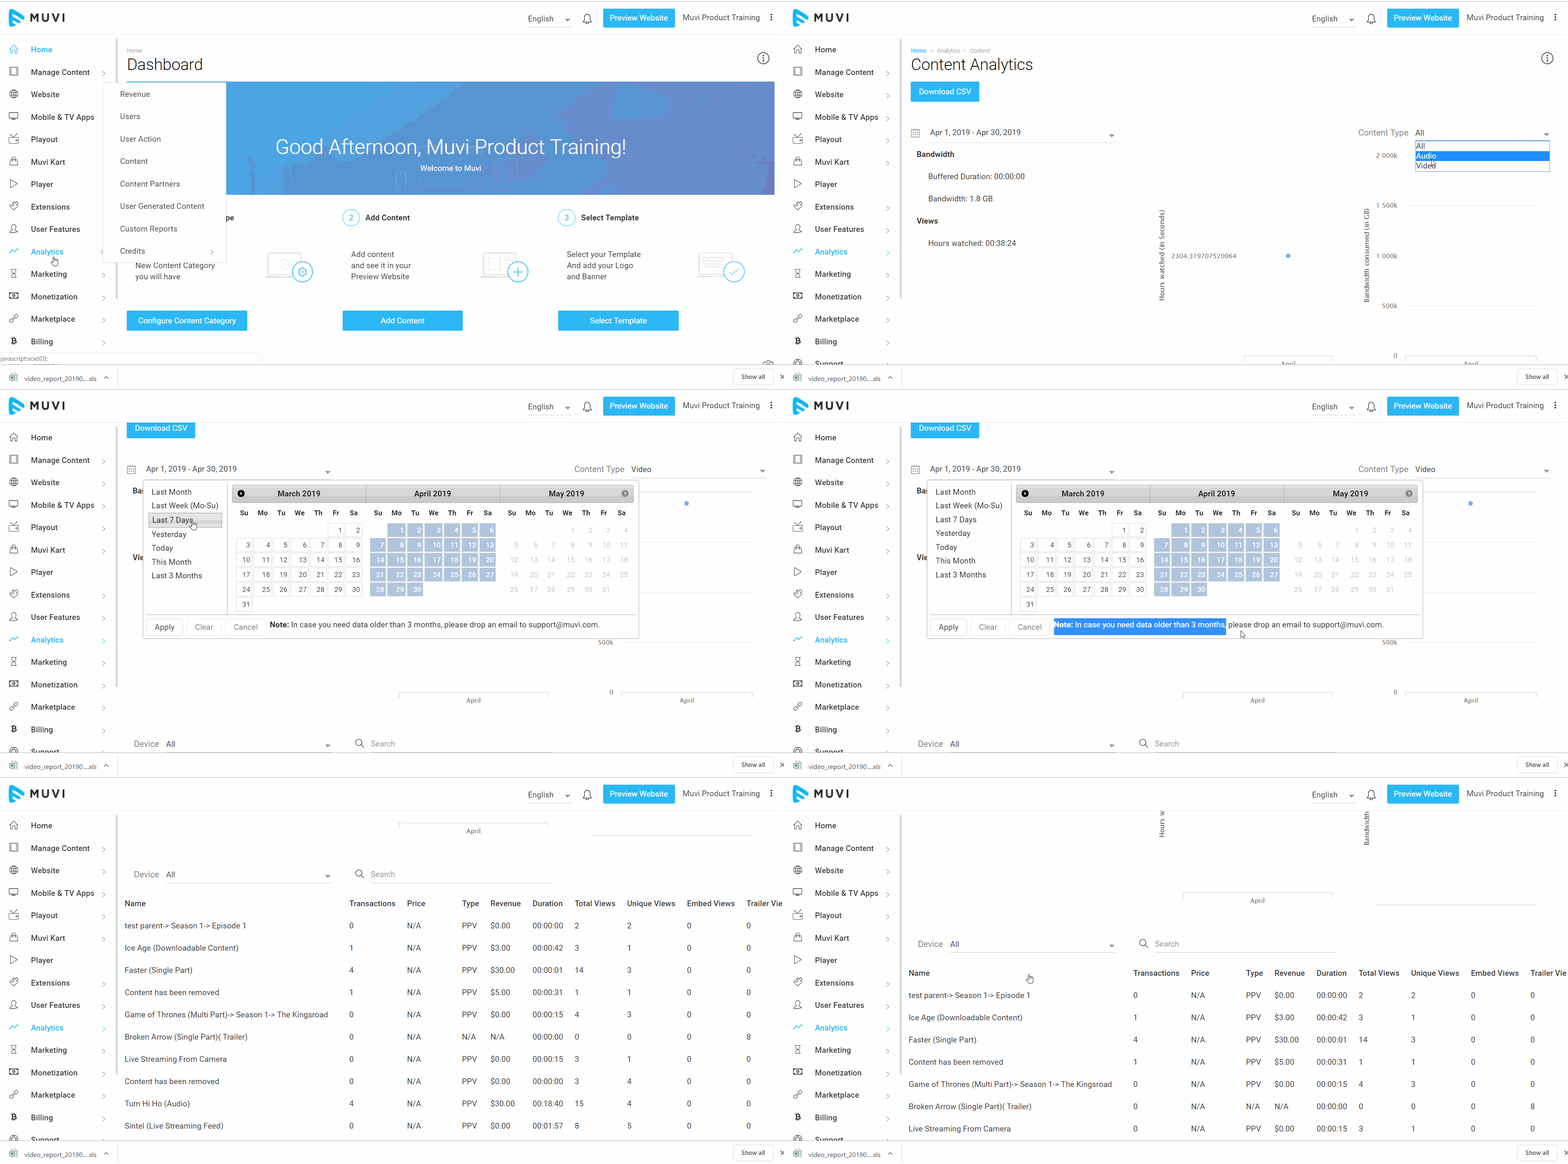
- To get the detailed report, go to "Analytics" --> "Content" in the CMS.
- On the right-hand side in the "Content-Type" field, select "Video" from the drop-down.
- Select a time period from the calendar and click on "Apply".
- The figure shows a real-time video analytic report for a particular period for a better understanding.
Note: You can only view 3 months' reports at once. In case you need data older than 3 months, please drop an email to support@muvi.com
How to View Audio Analytics Report
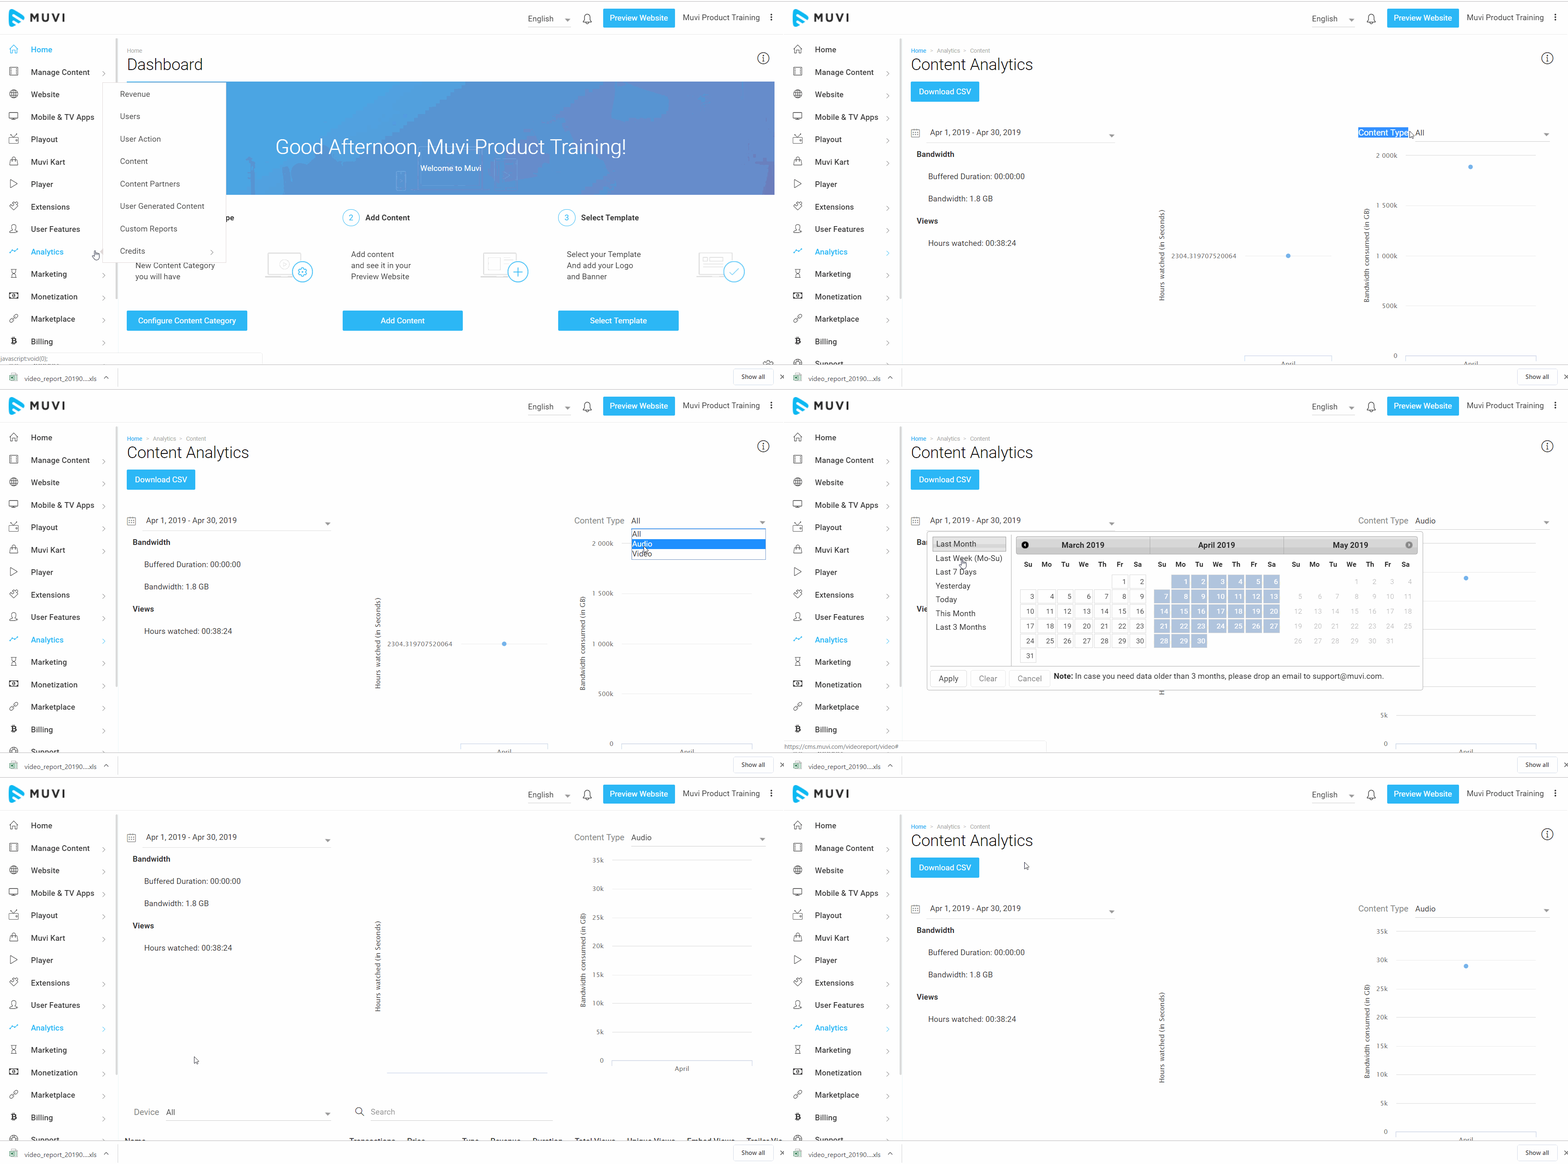
- To get the detail report, go to "Analytics" --> "Content" in the CMS .
- On the right-hand side in "Content Type" field, select "Audio" from the drop-down.
- Select a time period from the calendar and click on "Apply".
- The figure shows a real-time video analytic report for a particular period for a better understanding.
Note: You can only view 3 months report at once. In case you need data older than 3 months, please drop an email to support@muvi.com
Filtering Options in Content Analytics Report
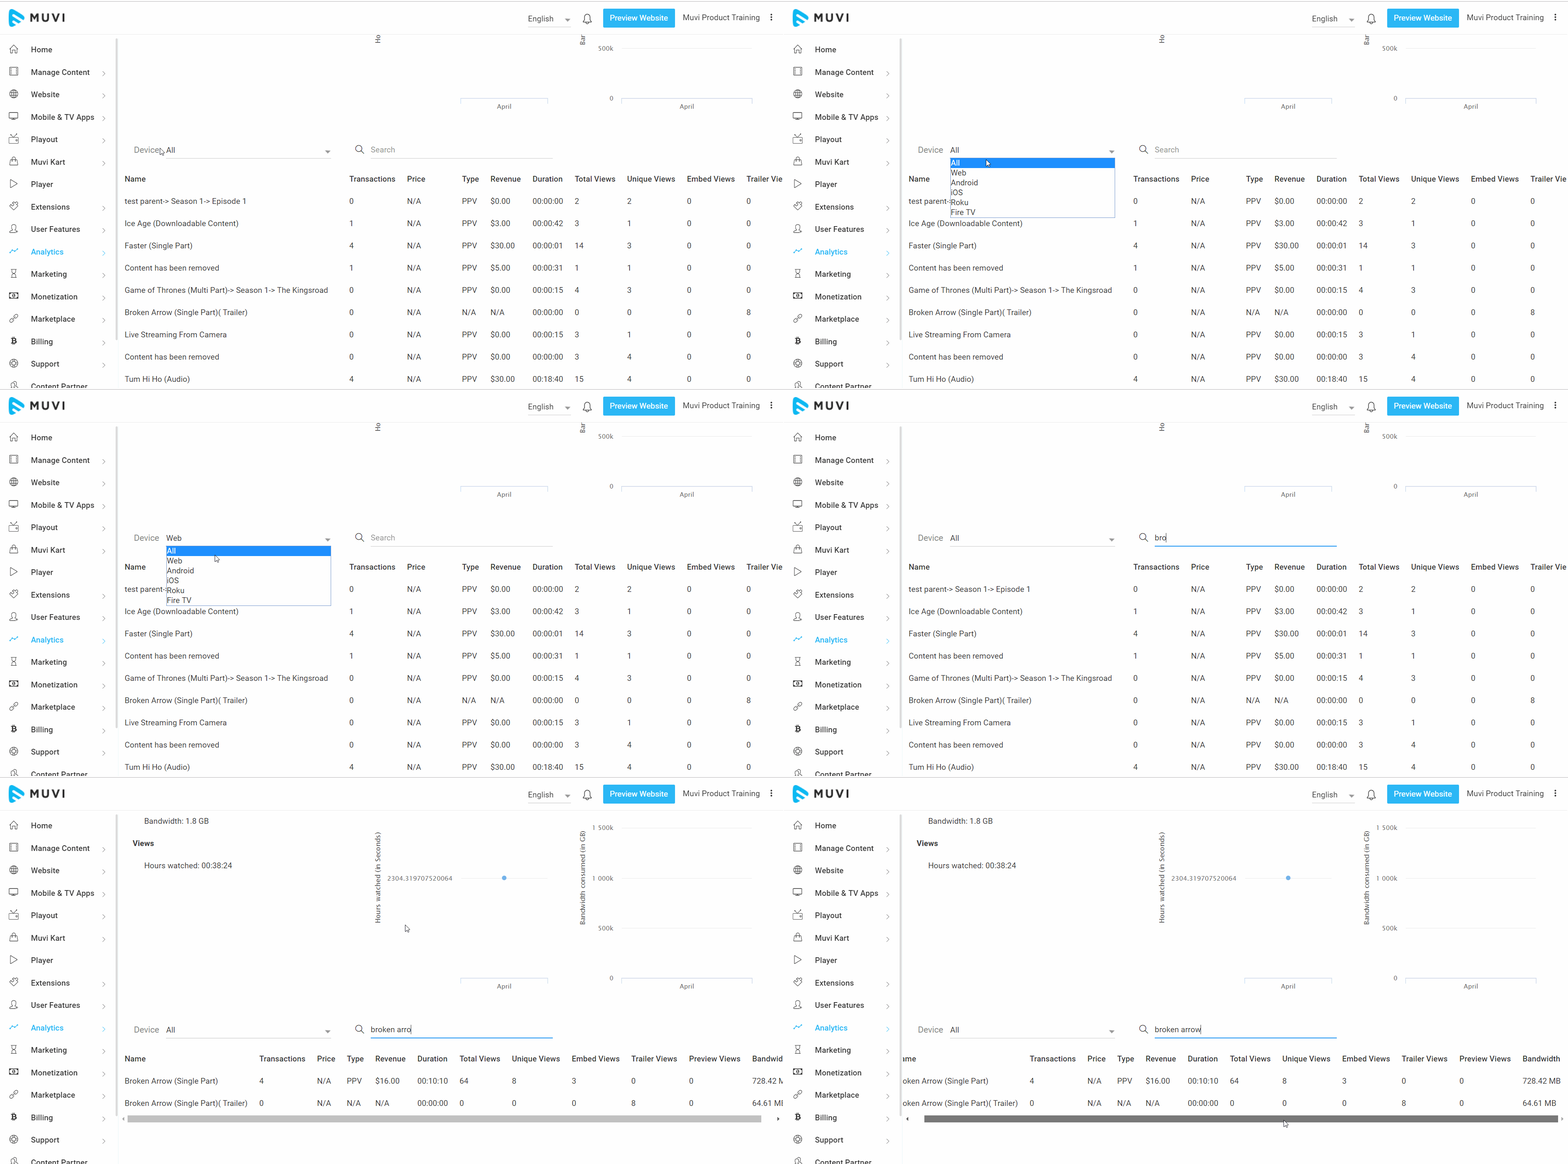
You can filter the Content Analytics report by Device wise or Content wise.
- To see the report by device wise, select the Device from the drop-down menu.
- To see the report content wise type the name of the content in the Search Bar.
Different Columns in Content Analytics Report
There are different columns in the Content Analytics Report including Name, Transactions, Price, Type, Revenue, Duration, Total Views, Unique Views, Embed Views, Trailer Views, Preview Views, Bandwidth, and Download. (See Below Screenshot)
- The name column shows the name of the content (Movie name, Series Name, etc.)
- Transactions column shows the total number of transactions of the content (How many times the content has been purchased)
- The price column shows the price of the content (The price will not show for free content or content purchased through voucher or coupon)
- The type column shows the type of monetization plan applied to the content (PPV, PPV Bundle, etc.)
- The revenue column shows the total number of revenues earned from the content
- *Duration column shows the total number of durations the content has been played by the end-users (i.e. 5 minutes, 1 hour, etc.)
- Total Views shows the total number of views of the content by the users (For example, if 2 different users view the same content for 5 times, the total number of views will be 10)
- @Unique Views column shows the number of unique views (For example if 10 different users watch the same content for once, then the unique views will be 10)
- Embed Views shows the number of views of the embed link shared for the content (If the embed link is viewed by 100 users, then embed views will be 100)
- #Trailer Views column shows the number of views of the trailer of the content (That means how many times the trailer has been viewed by different users)
- The Preview Views column shows the number of previews viewed by you.
- The bandwidth column shows the total number of bandwidth consumed for watching the content
- Download column shows how many times the content has been downloaded by the users (If you have selected the download option for the content)
*Note:
- Our log records the watch duration when the video is watched by the end-users for 2 minutes. The watch duration for end-user shows as 00:00:00 in the analytics when the user starts watching a video and before 2 minutes, they either close the browser/tab or click on the back button of the browser or got disconnected from the internet and closed the browser.
- #Currently, we are not displaying the log for the Trailer Views.
- @If you have disabled the "Registration & Login" option for the store, then the "Unique" views only show 1 view as the store Admin is by default logged in to the store when this option is enabled. So, all the end-users watch the content in the store with the Admin's login.

Downloading Content Analytics Report
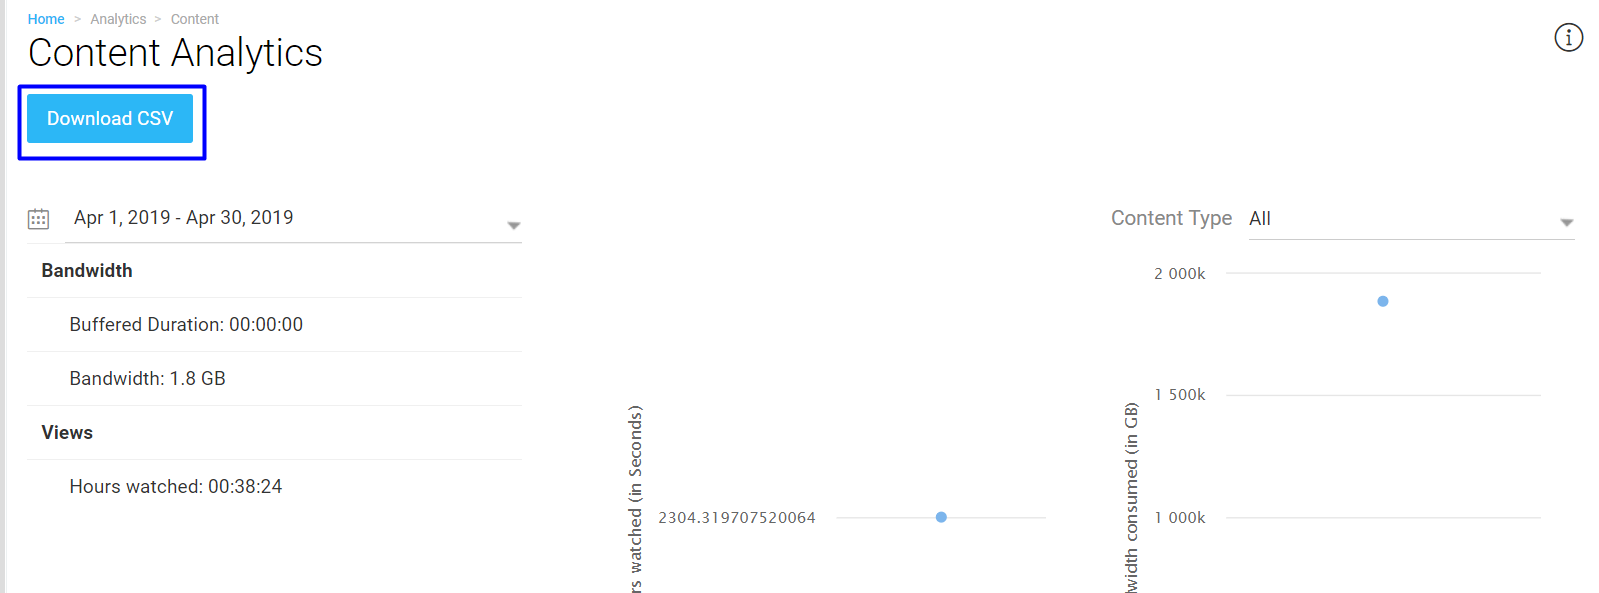
- To download the content analytics report, click on "Download CSV" (See Below Screenshot).
- The report will be downloaded in Microsoft Excel
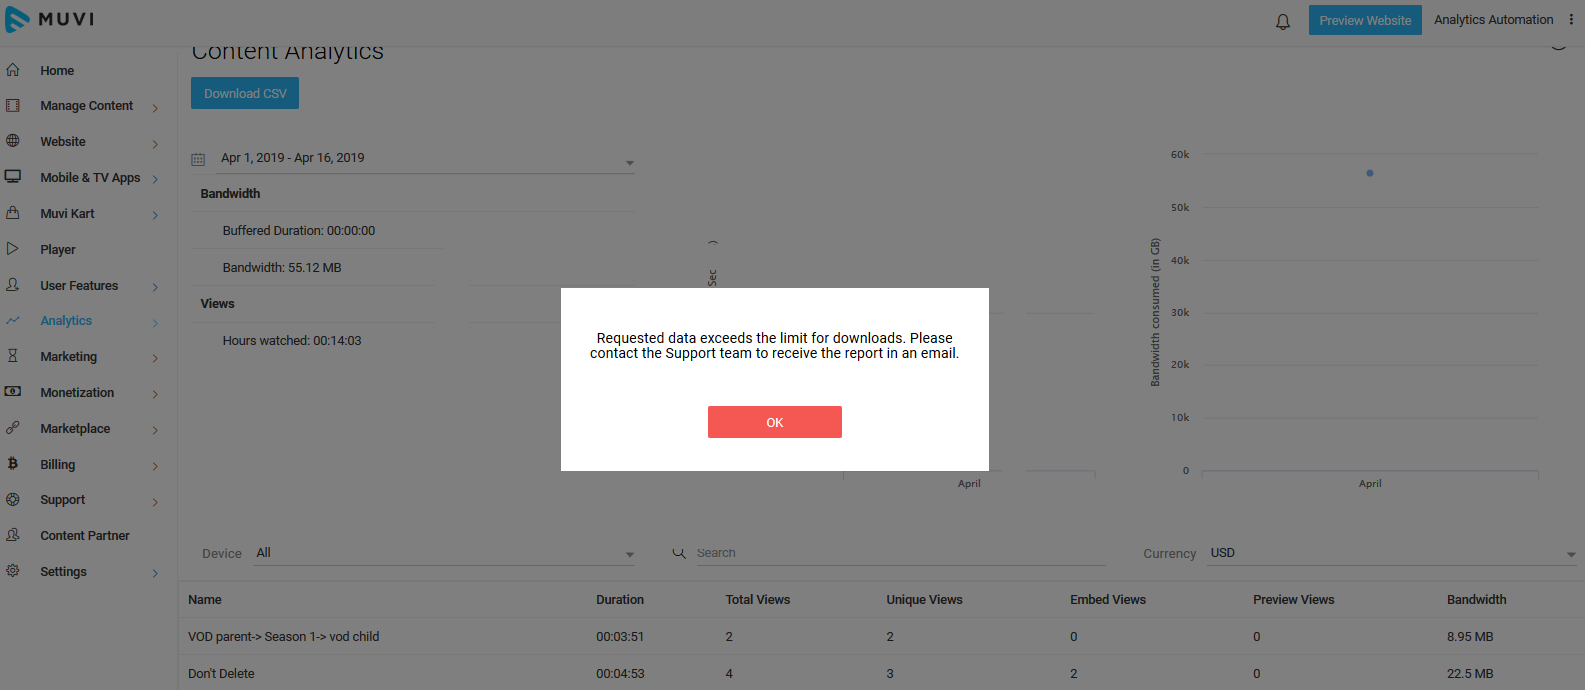
Note: You can only download the report for the number of records up to 30,000. If the number of records exceeds 30,000, then you will get a warning message. (See Below Screenshot)
Let us know so that we can improve.

February 24
12:00AM PST
Introducing TrueComply: Scaling Video Compliance with AI Automation
Video compliance has always been a critical requirement for broadcasters—and today, OTT platforms, streaming services, and enterprise video teams face the same challenge at a much larger scale.…...
Event Language: English

